Business Intelligence
Business Intelligence refers to procedures and processes for the systematic analysis (collection, evaluation and presentation) of data in electronic form. The main objective is to automate controlling, reporting, planning and forecasting in order to enable better operative or strategic decisions to achieve corporate targets.
In practice, Business Intelligence is primarily understood to mean the following points:
- Automation of controlling
- Reporting
- Planning and forecasting
- Market and customer analysis
The first task of a BI project is therefore to enter data for analysis in a separate database (data warehouse). This is done by extracting the 446 Plattform® data, transforming it and loading it into the data warehouse. The BI module performs these tasks automatically: First a data warehouse is generated and filled and then an OLAP cube is created on which analytical queries can be executed.
The second task involves setting up the analytical evaluations required for reporting. These can include, for example, simple aggregations of sales figures or extensive statistical analyses.
Overview
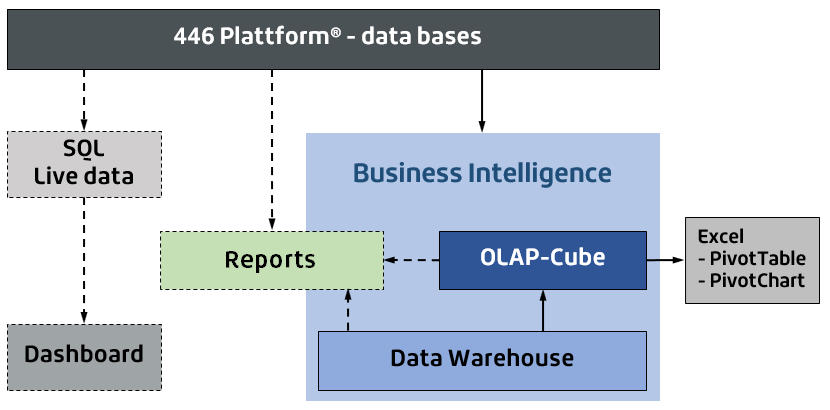
Figure: Relationship between the Business Intelligence module and the other analysis options of the 446 Plattform®
Terms
- Reports
The completely web-based, interactive reporting system provides functions for statistics and evaluation of the 446 Plattform® data.
Via the reporting, all of the MS SQL database fields, like ticket data fields, can be evaluated and presented in a clear visual form using graphs. A selection of predefined reports will be available right after the installation. Nevertheless, individual reports can be created as well. Due to the simple handling of the reporting, all important analysis regarding the entire helpdesk organization can be created quickly.
For special evaluations, selected ticket fields can be mirrored in the data warehouse.
Note:
As a requirement for the use of the reporting, the MS SQL Server Reporting Services (SSRS) have to be available and configured.
- OLAP cube
In contrast to the dashboard or the reports, this is not a visualization option for data and queries, but a new data source. The OLAP cube looks like a SQL database: A tool is needed to visualize the data. Many analysis tools can access the OLAP cube provided by the BI module because it has standardized interfaces. Thus, queries can also be formulated with Microsoft Excel, for example. However, the data can also be used by reports or even by the dashboard (although special widgets must be programmed for this).
- Data Warehouse
A data warehouse is a central database optimized for analysis purposes that combines and compresses data from multiple, usually heterogeneous sources. In concrete terms: The data warehouse provides the basis for the structure of the OLAP cube and contains all relevant data that can be used for an analysis. A detailed description can be found in the section Ticket fields in the data warehouse.
- Dashboard
In the narrower sense, a Dashboard should not be seen as part of Business Intelligence. However, it is well suited for certain key figures that are automatically updated, for example (ad hoc reporting). Dashboards should not be used for extensive and detailed reports.
An example for the use of a dashboard is the presentation of data from a live database on a separate monitor (weather data, stock prices, health data or data from the OLAP cube). Essentially, it is not the data that characterizes the dashboard, but the way it is displayed: Online in the browser with constant updating. The dashboard is therefore a simple graphical display option for queries, e.g. from the advanced search. This opens up possibilities for the user to design his own queries.
Chapters:


 Copyright (c) 2000-2026 Isonet AG