OLAP cube and Excel
The OLAP cube offers the following advantages and options:
-
The data are stored separately from the live database, so queries do not affect productive operation.
-
Queries are very powerful because they are already aggregated according to many criteria in the cube. In the query itself, no functions are required to form totals or other key figures. Instead, the data can be read using the dimensions provided. Performance is therefore often the main reason for using an OLAP cube.
-
It is possible to access historical data: A status is saved with each data generation. This makes it very easy to compare a particular sample with the previous month or year.
Drawbacks:
- A separate server is required for the cube (the productive instance should not be used for this).
-
Due to the system, the data is only up-to-date with the last cube filling (by default once per night).
-
Only data contained in the cube can be evaluated. A later addition is connected with programming effort (the generator must be adapted).
Connection with Excel
Microsoft Excel is a convenient tool for accessing the OLAP Cube and formulating queries. The following steps must be performed:
After starting Excel change to the menu item Data > Get Data >From Database > From Analysis Services.

Specify the server name of the SQL Server instance and click Next:
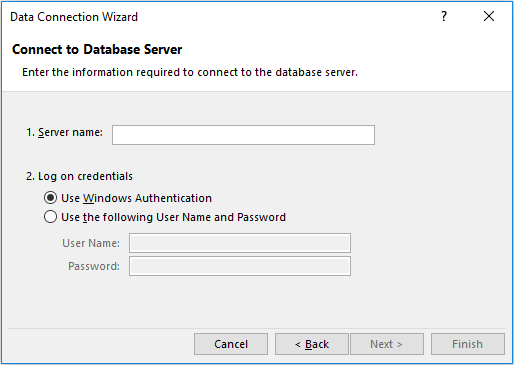
Select ticket cube and finish.

Overview: Ticket cube and pivot table fields

- Pivot table
Measurement groups - aggregatable values
Dimensions - values/objects for filtering and grouping
Areas in which measures or dimensions can be included (measures are aggregatable values and can only be used in the Values area).
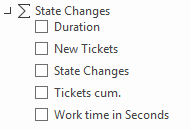
Status change
Based on the status change of the tickets
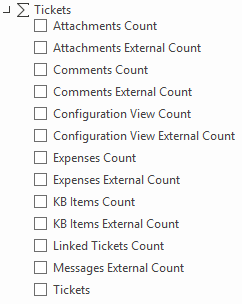
Tickets
Based on the tickets
Ticket times
Based on status change of tickets taking into account the service time stored in the ticket
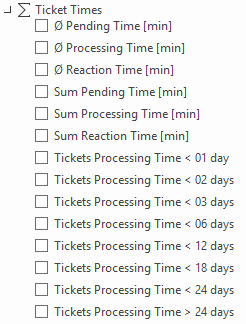
Processing time: Consideration of status of status type In process
Waiting time: Consideration of the status of the Waiting status type
Reaction time: Time period between ticket creation and first status change to a status of the In process type
Dimensions - detail information, filter, grouping
| Name | Description |
|---|---|
| Owner | Current owner of the ticket |
| Owner Group | Affected user of the ticket |
| Affected group | Current affected group |
| Date | Creation date of the ticket |
| Date aggregation | Returns functions to accumulate the values used over time. |
| Date aggregation until/Date aggregation from | Only in combination with date aggregation. Extends the date aggregation by a period of its own. |
| Date comparison | Provides functions to compare the values used over periods of different periods. |
| Creating Group | Created group of the ticket |
| Service | Hierarchy of service transactions: Service categories and service catalogs of the ticket |
| SLM escalation | Hierarchy of SLM priorities: SLM services and contracts of the ticket |
| Ticket | Ticket meta data |
| Ticket schema | Ticket schema of the ticket |
| Ticket status | Ticket status |
| Ticket status until | Filter and/or grouping option when using values from the status change measure group |
| Ticket status from | Filter and/or grouping option when using values from the status change measure group |
| Ticket value 1 – Ticket value 10 | Ticket fields and values, up to 10 uses as grouping or filtering |
| Responsible group | Current responsible group of the ticket |
| Responsible | Current responsible user |
Note:
Each dimension can only be used once in the filter, row or column area. For this reason there are the dimensions Ticket value 1 - 10. You can group/filter according to a total of 10 ticket fields or use the same ticket field in several areas.


 Copyright (c) 2000-2026 Isonet AG