Dashboard
The Dashboard allows for parallel processing and displaying of various kinds of information. For this purpose, it is possible to create widgets basing on templates (Master widgets) that plot this information.
Short instruction
General Information
The Dashboard can be modified individually by every user. By clicking Add widget one of the Dashboard widget templates provided can be added to the Dashboard. A dialog is opened where all widget templates are displayed in a tree view, sorted by category.
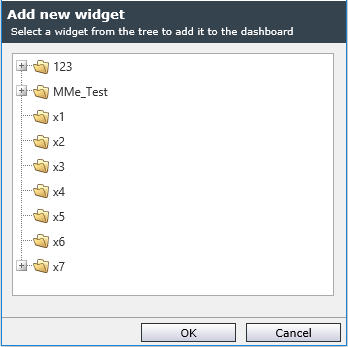
By double-clicking the desired widget template or by selecting the template and clicking OK the widget will be added to the Dashboard.
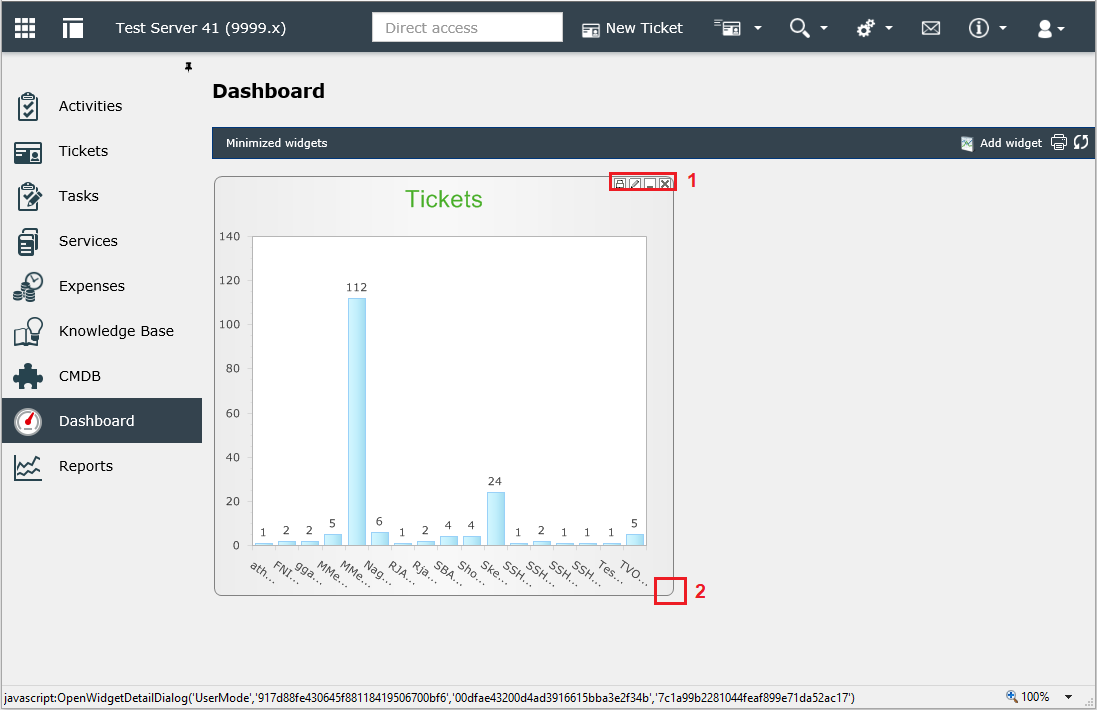
By using the configuration buttons [1], a widget can be printed, modified, minimized and removed from the Dashboard. These buttons appear as soon as the mouse is placed on the widget.
If a widget has been released for customization by the administrator, it can be configured it according to any needs. If a name has been assigned to the widget, it can be modified by clicking on the name. Otherwise, this option is also provided with the central configuration button.
Widgets can be removed temporarily from the Dashboard by selecting the Minimize button whereas size and location of the widget are saved. With the button Minimized widget the widget can be called again.
The size of the widget can be modified by dragging the lower right edge [2] of the widget.
Configuring widget settings
In the configuration dialog under Details, all widget information can be configured and adapted to the own needs.
Details
Under Details, the various general details of the widget can be configured.
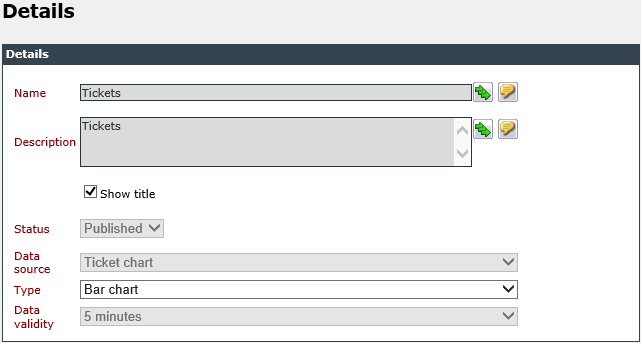
In the Name field a significant name is to be entered for the widget.
In the Description field the description for the widget can be adjusted.
If multiple languages are installed on the system, the name and description of the widget can be specified in the available languages as follows:
By clicking on the localization buttons, the entered name or description ( ) will be used (
 ) in all installed languages.
If the option Show title is activated, the name is set as the widget heading in the Dashboard.
In the selection box Type the user can define the diagram type that is used for displaying data in the widget. There are different bar charts, pie charts, line charts and area diagrams. Please note that not every type of diagram is useful for every information to be displayed with a widget.
Note:
Status, data source and data validity cannot be modified.
Settings
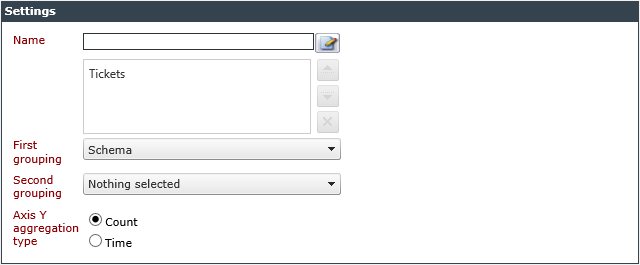
Under Settings the user can define search requests for the widget in order to filter the displayed data. In the Name field a name for the search request needs to be entered. By selecting the button next to this field, the dialog for defining the search request opens.
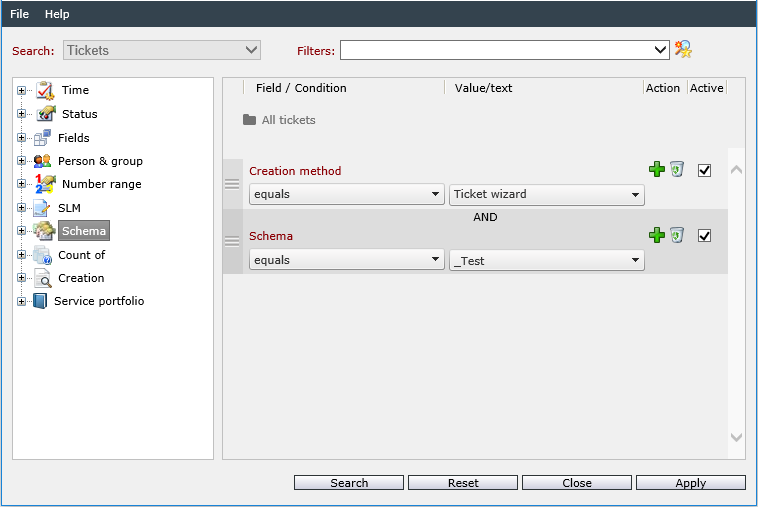
In this dialog different search requests can be configured. Furthermore, predefined search templates can already be integrated into a widget (see also Related Topics). The search request can only be executed for the defined data source. Please note that all information is not to be collected by using one single search request as data grouping will not be possible in this case.
Note:
It is necessary to group all data sources.
If the search request is configured, the request is saved by selecting Apply.
In the selection box First Grouping the search request can be grouped by different criteria in the first level. If, for example, the tickets created in the last 24 hours are to be displayed in the widget, it is advisable to select the grouping Ticket number by schema.
In the selection box Second Grouping the search request can be grouped by different criteria in the second level which is useful if complex data constructs are to be displayed in the widget or if data is to be compared. The second grouping can only be used if at most one search request has been placed.
By selecting Axis Y aggregation type the user can specify whether Count or Time values are to be displayed on the vertical axis.
Visual settings
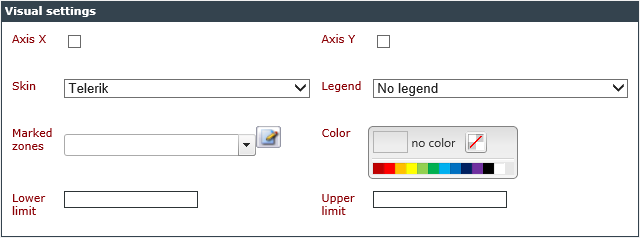
If one of the settings Axis X or Axis Y is activated, describing, localized axis names can be used.
Under Skin a skin can be selected to individually customize the appearance of the widget.
If under Legend one of the options Show legend inside chart or Show legend outside chart is selected, a legend will be placed into the widget or outside of the widget.
Under Marked zones the user can define zones to set an upper or lower limit, e.g. for bar charts. For this purpose, a significant name needs to be entered for the zone.
Afterwards, a Color is to be selected for the zone.
The field Lower limit defines the lower limit of the zone.
The field Upper limit defines the upper limit of the zone. The value of the upper limit has to be higher than the value of the lower limit.
Warning:
For both the upper and the lower limit only whole-numbers need to be used. Furthermore, the limiting values need to differ as otherwise the creation of the widget cannot be concluded if both values are identical.
More zones can be added or modified by selecting the field of marked zones. To create a zone, a new name has to be entered. To modify a zone, the zone is selected in the selection field and the options of the zone can be modified. If a zone shall be deleted, it is selected in the selection field and deleted by clicking the Remove button.
By selecting Save all changes are saved.


 Copyright (c) 2000-2026 Isonet AG