Example key figures
Number of open tickets of a schema per owner
Objective: Display only the open (= Not closed) tickets of a certain ticket schema and output the current owner.
- Add a schema filter
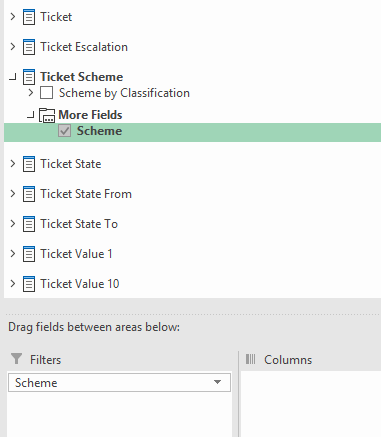
Drag and drop from the Dimension Ticket Schema > More fields > Schema into the filter pane
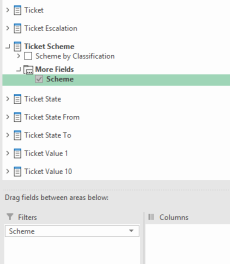
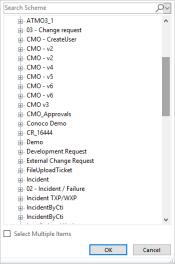
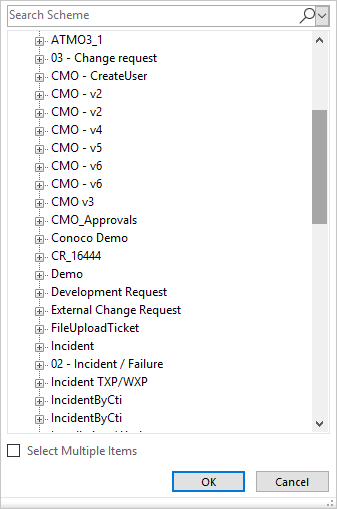
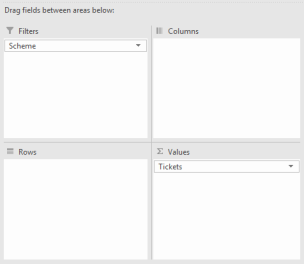
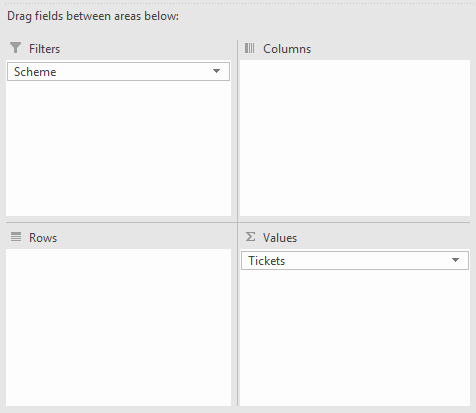
A drop-down list with all ticket schemes is now displayed in the pivot table area. This is where the corresponding ticket schema filtering is performed (e.g. error message):
- Show number of tickets
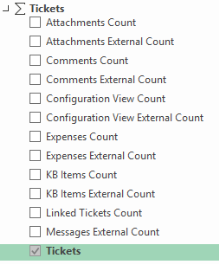
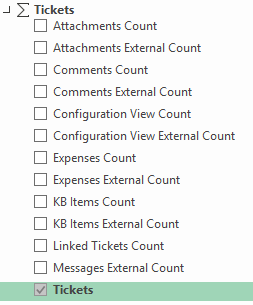
Drag tickets from the Tickets-Measure group into the value range or simply mark them. This displays the number of tickets for the filtered ticket scheme in the pivot table.
- Group by ticket status
Drag Dimension Ticket Status > More fields > Ticket Status.Status into the Row Area. The ticket statuses are now added to the pivot table as rows and the number of tickets is calculated according to the status.
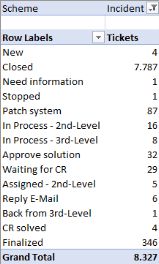
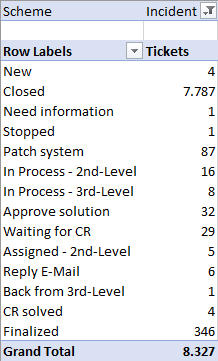
- Do not consider or remove Closed status
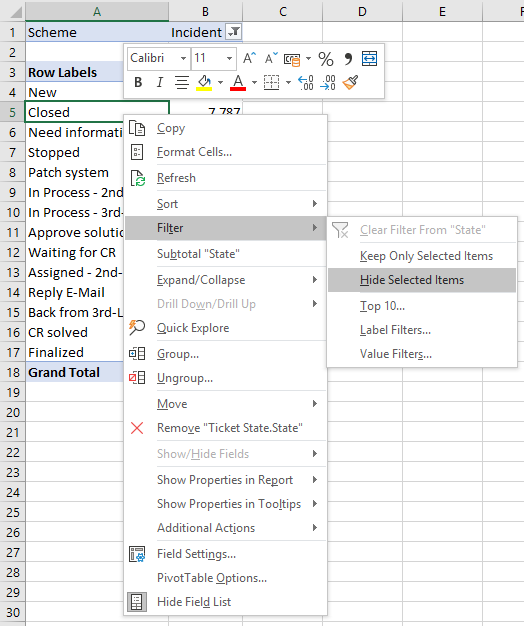
In the pivot table, right-click on Closed > Filter > Hide Selected Items
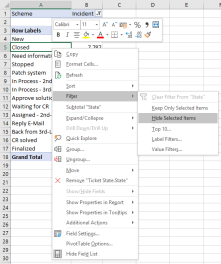
Consequence: Tickets with the status Closed are no longer taken into account in the calculations.
- Grouping by owner
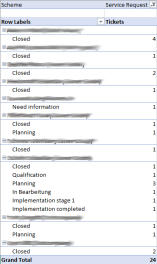
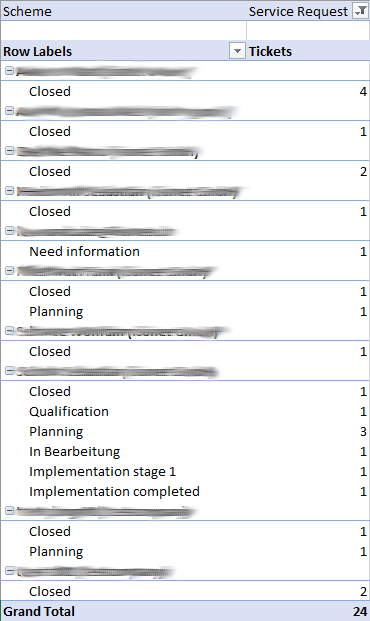
Drag Dimension Owner > More fields > Owner.Principal into the row area and place it above the status. It is first grouped by owner, then by status.
- Add ticket numbers and titles
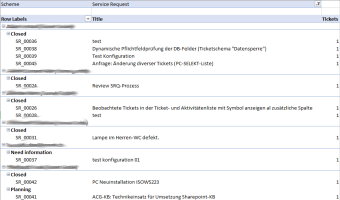
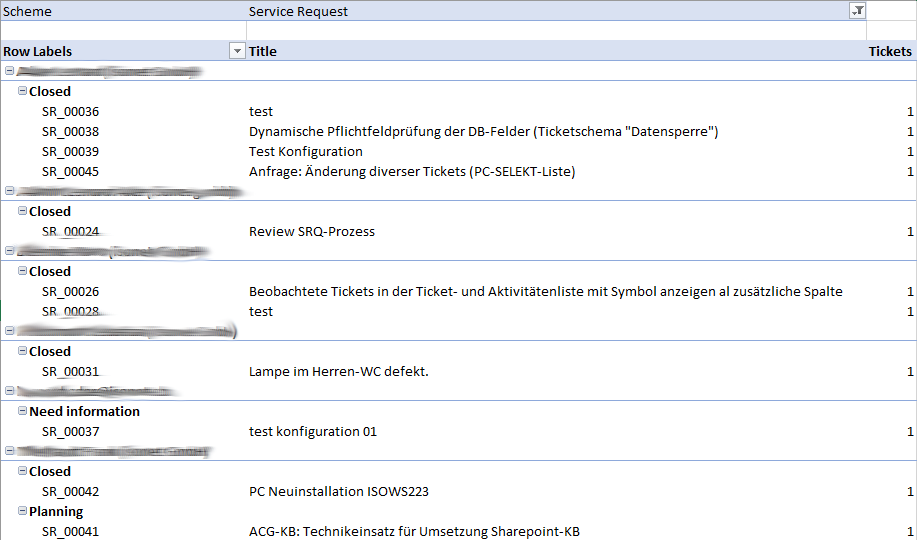
Add Dimension Ticket > More fields > Add Ticket to the row area: The pivot table is also grouped according to the corresponding ticket.
To output the ticket title as additional information: Right-click in the pivot table on a Ticket number > Show Properties in Report > Title
Number of tickets with a certain value in ticket field A, grouped by ticket field B
- Add Ticket Schema Filter
See above - Section 1
- Add number of tickets
See above - Section 2
- Use ticket field as filter
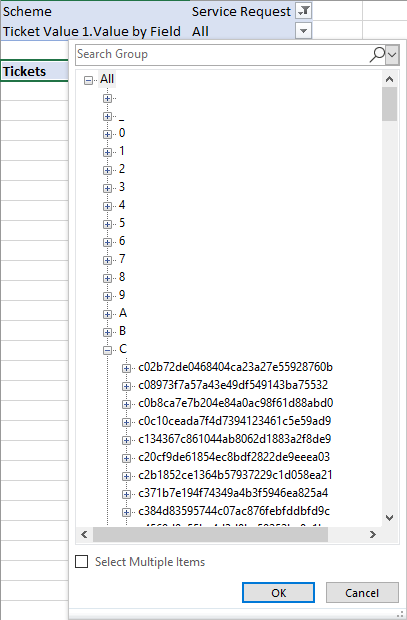
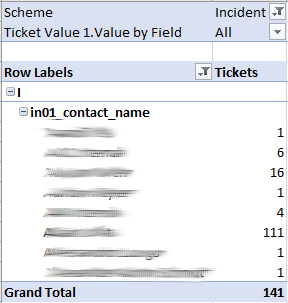
Drag Dimension Ticket value 1 > Ticket value1.value to field into the filter area. A new drop-down list for filtering appears in the pivot table. This list contains all ticket field values, grouped by their ticket field FriendlyNames.
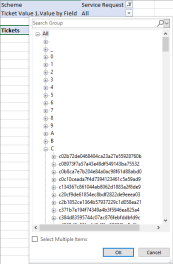
To filter by a ticket field value, select the FriendlyName of the corresponding ticket field and expand the corresponding node. The ticket field value to be filtered is then marked.
Example:
I > in01_contact_company > Isonet ag
- Group by ticket field
Analog point 1: Select another ticket value dimension and drag it into the row area this time. Expand the ticket field hierarchy and click to the FriendlyName of the desired ticket field. Right-click on Ticket Field > Filter > Keep Selected Items Only.
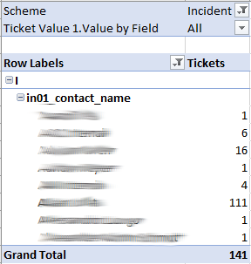
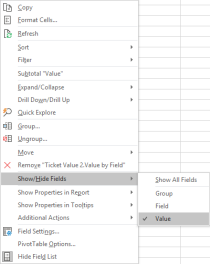
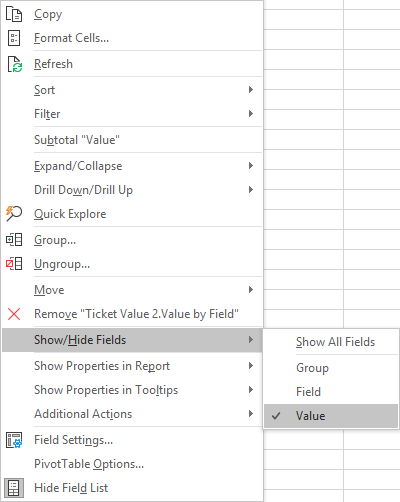
The upper two nodes of the ticket field hierarchy can also be hidden:
Right click on the hierarchy
Show/Hide fields > Exclude group and field
Date aggregation (Accumulate values)
Date aggregation is used to accumulate the values used in the value range over various periods. This requires the use of the Date dimension.
Add any groups, filters, and values to the pivot table
Add Date.Calendar from the Date dimension to the row area
Moving the Date Aggregation dimension to the column area
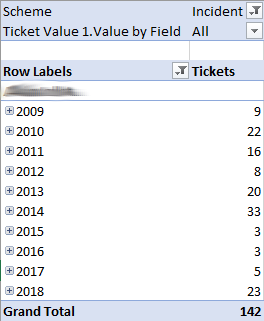
Before adding the date aggregation:
After adding the date aggregation:
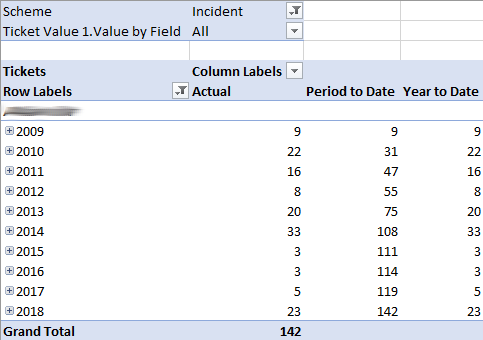
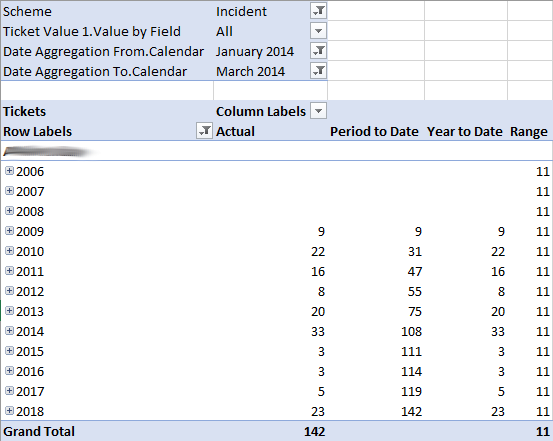
Two additional columns Period to Date and Year to Date appear. If the date hierarchy is expanded further, additional accumulated values are added for each level for the newly visible periods.
Date aggregation-from/Date aggregation-to (Accumulate values)
The dimensions Date Aggregation From and Date Aggregation To serve as additions to date aggregation. Both dimensions can be added to the filter area to specify their own time span/period. For this, the corresponding values are calculated and displayed as a Range column in the pivot table. There is no further accumulation for this period.
Date comparison (compare values)
The Date Comparison functions in the same way as Date Aggregation and can only be used together with the date dimension. In contrast to aggregation, date comparison does not accumulate the values, but totals them for the individual periods and compares them with the corresponding previous period:
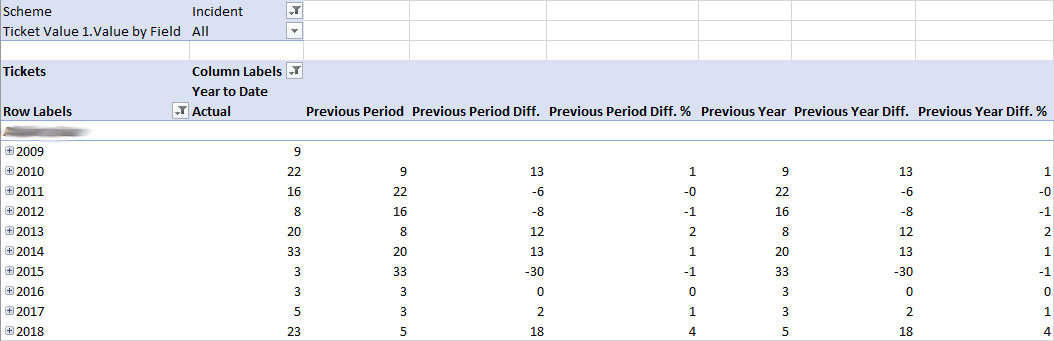
A user-defined period (as described under Date Aggregation From/Date Aggregation To) is not possible here.


 Copyright (c) 2000-2026 Isonet AG